The short version
- There is no single AI Overview rate. In our sample of 800 commercial keywords, 60.8% showed one (95% interval 50.1% to 71.5%), but only 40.8% when weighted by search volume, 53.8% among the highest-volume keywords and 98.1% among question-form keywords. A 2026 study of 55,393 trending queries found 13.7%. The figure depends on which searches are counted.
- The local pack (the map with three businesses) is the strongest signal. Holding industry, intent, “near me”, length and volume constant, a search with a local pack had a 30.7% predicted chance of an AI Overview against 78.6% without one (odds ratio 0.07). The gap appeared in every industry that had local packs.
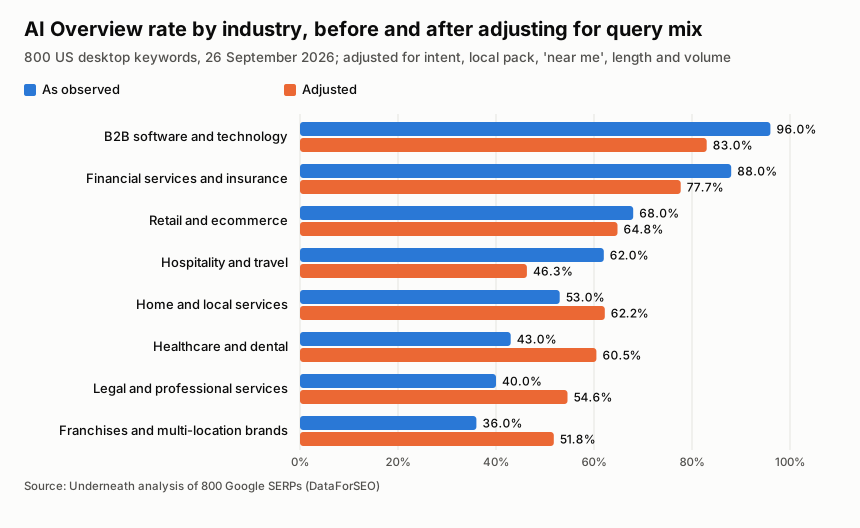
- Industry still matters, but less than the raw table suggests. The observed range between industries was 60.0 points; after adjusting for query mix it was 36.7 points. B2B software (83.0% adjusted) and financial services (77.7%) stay highest.
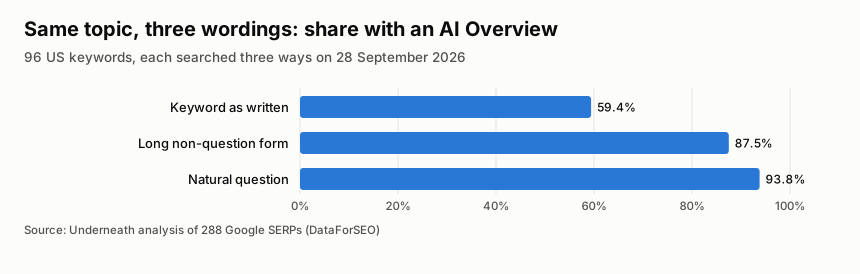
- Wording changes the outcome for the same topic. We searched 96 keywords three ways: as written, 59.4% showed an AI Overview; as a long non-question form, 87.5%; as a natural question, 93.8%. Most of the lift came with the longer, more specific wording. The question form added 6.3 points over the long form, which was not statistically significant.
- Once an AI Overview appears, most of what it cites does not rank on page one. It cited a median of 8 sources; 30.2% of cited URLs (44.3% of cited domains) were in the organic top 10 of the same search, and 20.2% of AI Overviews cited no top-10 URL at all.
- A citation is not always support. In a model-coded pilot of 97 cited sentences, both coders agreed on a judgment for 71: 66.2% were supported by the cited page, 21.1% partly and 12.7% not.
- The outcome is fairly stable over two days but the sources are not. Re-searching 96 keywords two days later, 83.3% had the same outcome (16 flipped); where both days showed an AI Overview, the median overlap of their cited URLs was 0.43 (Jaccard).
Research questions
| Question | Answered here? |
|---|---|
| RQ1. Which features of a search go with an AI Overview, and does industry matter once they are held constant? | Yes, with a clustered logistic model |
| RQ2. For the same topic, does the wording change activation? | Yes, with a matched experiment (96 topics, three wordings) |
| RQ3. How much does the headline rate depend on what is counted? | Yes |
| RQ4. Which sources are cited, and do they rank on page one? | Yes |
| RQ5. Does the cited page support the sentence it is attached to? | Pilot only (97 sentences, model-coded) |
| RQ6. Does the same keyword get the same outcome on another day? | Partly: two dates, 96 keywords |
Visibility in stages
Being visible in Google’s AI answers is not one number. This study measures the first stages separately and names the later ones it does not measure.
| Stage | Question | Measured? |
|---|---|---|
| Activation | Does Google show an AI Overview for this search? | Yes, 1,248 searches |
| Source selection | Which pages are cited, and do they rank in the top 10? | Yes, 643 AI Overviews |
| Grounding | Does the cited page support the sentence? | Pilot, 97 sentences |
| Stability | Is the outcome the same on another day? | Two dates, 96 keywords |
| Retrieval | Which pages did the system consider? | No: only the organic top 10 is visible |
| Influence | Did a source shape the answer? | No |
| User outcome | Did anyone click, trust or act on it? | No |
What we measured
Main sample. From DataForSEO’s US keyword database we took four seed topics per industry (for example “plumber”, “dental implants”, “personal injury lawyer”, “crm software”), 32 in all. For each industry we kept the 40 highest-volume suggestions and 60 more drawn at random from the rest, 800 keywords, plus a separate sample of 160 question-form keywords (20 per industry). Each was searched once on Google.com, United States, English, desktop, on 26 September 2026, with the AI Overview allowed to load. The sample leans toward popular commercial searches (median 165,000 monthly US searches), so it estimates AI Overview exposure among the keywords businesses in these industries track, not across all Google searches.
Matched wordings. We drew 96 of the 800 keywords at random (12 per industry, excluding keywords that were already questions or contained “near me”). For each, we wrote a natural question and a long non-question form on the same topic, for example “dentist crowns” → “how much does a dental crown cost” → “dental crown cost with and without insurance”. All three were searched on 28 September 2026 with the same settings. The keyword as written doubles as a second date for those 96 keywords.
Grounding pilot. From the AI Overviews of 26 September we drew 120 (15 per industry), picked one sentence with a citation from each, fetched the first page cited for it and kept the passages that shared the most words with the sentence. Two AI models, working independently, judged whether those passages support the sentence.
Keywords that share a seed topic are not independent, so the 95% intervals and the model’s standard errors are computed by seed topic, not by keyword.
Findings
How often, by industry and type of search
| Industry | Keywords | With an AI Overview | 95% interval | Question-form keywords with one |
|---|---|---|---|---|
| B2B software and technology | 100 | 96.0% | 85.9% to 100.0% | 90.0% |
| Financial services and insurance | 100 | 88.0% | 79.5% to 92.5% | 100.0% |
| Retail and ecommerce | 100 | 68.0% | 39.5% to 85.5% | 95.0% |
| Hospitality and travel | 100 | 62.0% | 41.4% to 90.9% | 100.0% |
| Home and local services | 100 | 53.0% | 34.0% to 69.8% | 100.0% |
| Healthcare and dental | 100 | 43.0% | 26.9% to 75.8% | 100.0% |
| Legal and professional services | 100 | 40.0% | 25.9% to 56.6% | 100.0% |
| Franchises and multi-location brands | 100 | 36.0% | 18.6% to 64.6% | 100.0% |
| All industries | 800 | 60.8% | 50.1% to 71.5% | 98.1% |
Question-form column: 20 keywords per industry. The wide intervals show that within an industry, the result depends heavily on the seed topic.
| Search type | Keywords | With an AI Overview |
|---|---|---|
| Question-form (separate sample) | 160 | 98.1% |
| Informational intent | 181 | 73.5% |
| Commercial intent | 366 | 65.0% |
| Transactional intent | 165 | 50.3% |
| Navigational intent | 88 | 36.4% |
| Results page has a local pack | 275 | 21.8% |
| Contains “near me” | 75 | 17.3% |
| Contains a price or cost word | 31 | 100.0% |
Intent labels are DataForSEO’s classification. Every one of the 31 keywords with a price or cost word (“cost”, “price”, “fees”, “how much”) showed an AI Overview.
What goes with an AI Overview when everything is held constant
A logistic regression on all 800 keywords, with standard errors clustered by the 32 seed topics:
| Feature | Odds ratio | 95% interval | Change in probability |
|---|---|---|---|
| Results page shows a local pack | 0.07 | 0.04 to 0.13 | −36.4 points |
| Contains “near me” | 0.27 | 0.12 to 0.62 | −18.0 points |
| Each extra word in the search | 1.31 | 1.05 to 1.64 | +3.8 points |
| Monthly volume (per tenfold increase) | 0.89 | 0.63 to 1.26 | −1.6 points |
| Transactional intent (vs commercial) | 0.44 | 0.22 to 0.88 | −11.2 points |
| Informational intent (vs commercial) | 0.61 | 0.30 to 1.24 | −6.8 points |
| Navigational intent (vs commercial) | 0.62 | 0.29 to 1.34 | −6.5 points |
| B2B software (vs home and local services) | 5.17 | 1.14 to 23.44 | +22.7 points |
| Financial services (vs home and local services) | 3.18 | 1.30 to 7.81 | +16.0 points |
Change in probability is the average marginal effect. Industry as a whole remained significant (Wald test, p < 0.001); intent as a whole did not (p = 0.14). Once the other features are held constant, search volume has no clear effect, and neither does whether a keyword came from the highest-volume group or the random draw (odds ratio 0.8, interval 0.41 to 1.56). The effect of length did not differ by intent (p = 0.54).
How much each set of information predicts the outcome, measured by cross-validated AUC (0.5 is a coin toss, 1.0 is perfect; folds split by seed topic):
| Information used | AUC |
|---|---|
| Intent label only | 0.581 |
| Industry only | 0.586 |
| The words of the query (length, “near me”, price word, “best” or “top”) | 0.635 |
| Intent and the words of the query | 0.669 |
| Plus whether the results page has a local pack | 0.832 |
| Everything, including industry and volume | 0.845 |
The query text on its own predicts the outcome only modestly. Knowing whether Google also shows a local pack is what lifts the prediction, which suggests that Google first decides what kind of results page a search deserves, and a map-led page rarely gets an AI Overview.
Industry, before and after adjusting for query mix
| Industry | Observed | Adjusted | Local pack on the page | Navigational or transactional intent |
|---|---|---|---|---|
| B2B software and technology | 96.0% | 83.0% | 2.0% | 0.0% |
| Financial services and insurance | 88.0% | 77.7% | 18.0% | 6.0% |
| Retail and ecommerce | 68.0% | 64.8% | 20.0% | 60.0% |
| Home and local services | 53.0% | 62.2% | 49.0% | 51.0% |
| Healthcare and dental | 43.0% | 60.5% | 60.0% | 39.0% |
| Legal and professional services | 40.0% | 54.6% | 70.0% | 3.0% |
| Franchises and multi-location brands | 36.0% | 51.8% | 56.0% | 52.0% |
| Hospitality and travel | 62.0% | 46.3% | 0.0% | 42.0% |
Adjusted: the average predicted rate if every keyword in the sample belonged to that industry, holding the other features as they are. The observed range of 60.0 points shrinks to 36.7 points: about 39% of the industry gap is explained by the kind of searches each industry has. Healthcare, legal and franchise keywords show few AI Overviews largely because their results pages are dominated by local packs. Travel moves the other way: it had no local packs at all, so once that is accounted for, its rate is the lowest.
Local searches are still the map’s territory
| Industry | Local pack: keywords | Local pack: with an AI Overview | No local pack: keywords | No local pack: with an AI Overview |
|---|---|---|---|---|
| Financial services and insurance | 18 | 55.6% | 82 | 95.1% |
| Retail and ecommerce | 20 | 30.0% | 80 | 77.5% |
| Home and local services | 49 | 28.6% | 51 | 76.5% |
| Legal and professional services | 70 | 24.3% | 30 | 76.7% |
| Healthcare and dental | 60 | 13.3% | 40 | 87.5% |
| Franchises and multi-location brands | 56 | 7.1% | 44 | 72.7% |
The gap appears in all six industries with enough local packs to compare, and it does not differ significantly between them (p = 0.099). Across all 800 keywords, 21.8% of searches with a local pack showed an AI Overview against 81.1% without one, 3.7 times as often. After adjustment the predicted rates are 30.7% and 78.6%. The local pack is itself Google’s choice, so this shows that the two rarely appear together, not that one suppresses the other.
Same topic, three wordings
| Wording (96 topics, 28 September) | Median words | With an AI Overview | With a local pack |
|---|---|---|---|
| Keyword as written | 4 | 59.4% | 35.4% |
| Long non-question form | 9 | 87.5% | 11.5% |
| Natural question | 8 | 93.8% | 9.4% |
Pair by pair, the question form gained an AI Overview on 34 topics and lost one on 1 (exact McNemar test, p < 0.001); the long form gained 28 and lost 1 (p < 0.001). Between the question and the long form, the question gained 10 and the long form 4 (p = 0.18). Of the 39 topics with no AI Overview as written, 87.2% got one as a question and 71.8% as a long form. Of the 34 whose keyword showed a local pack, 88.2% got an AI Overview when asked as a question.
Rewording did two things at once: it made the search longer and more specific, and it mostly removed the local pack. Question form and length move together too closely in this design to separate them cleanly (in a model with both, word count was no longer significant). What the experiment does show is that, for the same topic, a specific, sentence-like search is far more likely to get an AI Overview than a short keyword.
| Industry (12 topics each) | As written | Long form | Question |
|---|---|---|---|
| B2B software and technology | 91.7% | 91.7% | 100.0% |
| Financial services and insurance | 91.7% | 100.0% | 100.0% |
| Hospitality and travel | 66.7% | 83.3% | 91.7% |
| Healthcare and dental | 58.3% | 91.7% | 100.0% |
| Retail and ecommerce | 50.0% | 91.7% | 100.0% |
| Home and local services | 41.7% | 66.7% | 75.0% |
| Franchises and multi-location brands | 41.7% | 100.0% | 83.3% |
| Legal and professional services | 33.3% | 75.0% | 100.0% |
In the version 1.0 question sample, which was drawn separately from question-form suggestions, questions beat the main sample within 25 of the 30 seed topics that had both, by a mean 31.8 points. Those questions were also longer (median 6 words against 4). The matched design above is the fairer comparison.
How much the denominator matters
| What is counted | With an AI Overview |
|---|---|
| Question-form keywords (160) | 98.1% |
| Keywords without a local pack (525) | 81.1% |
| Randomly drawn keywords (480) | 65.4% |
| All 800 keywords | 60.8% |
| Highest-volume keywords (320) | 53.8% |
| All 800, weighted by search volume | 40.8% |
| Keywords with a local pack (275) | 21.8% |
The volume-weighted figure is 20.0 points lower because a few enormous searches dominate the total: the 10 highest-volume keywords make up 38.4% of all volume, and only 2 of them showed an AI Overview. By volume fifth, the rate fell from 70.5% in the smallest fifth to 50.5% and 56.7% in the two largest, but once local packs and intent are held constant, volume has no clear effect: the biggest searches are disproportionately local and navigational.
Holding everything else about our keywords fixed, the model predicts 78.6% if no results page had a local pack, 66.1% if a quarter did and 53.6% if half did (the sample has 34.4%). The same method on the same day can give any figure in this range, depending on the mix of searches. A published AI Overview rate is only meaningful alongside the population of searches it was measured on.
Two days later
We searched the 96 matched keywords as written on both 26 and 28 September. 61.5% showed an AI Overview on the first date and 59.4% on the second. 83.3% had the same outcome on both days: 7 gained an AI Overview and 9 lost one. Whether the page showed a local pack was more stable (the same on 96.9%). Where both days showed an AI Overview (50 keywords), the median overlap of cited URLs between the two days was 0.43 and of cited domains 0.58 (Jaccard: shared divided by all distinct). A single search is a sample, not a fixed property of the keyword.
Which sources an AI Overview cites
Across all 643 AI Overviews (main and question samples), the median number of cited sources was 8 (middle half 6 to 10, range 0 to 29; 0.8% cited none). Navigational searches cited fewer (median 5.5), question searches slightly more (median 9).
| Source type | Share of 5,449 citations | Share on transactional searches | Share that also rank in the top 10 |
|---|---|---|---|
| Other websites (brands, publishers, blogs) | 59.4% | 33.9% | 41.1% |
| Forums, social and video | 21.2% | 16.8% | 11.0% |
| Google’s own pages | 12.0% | 37.9% | 1.5% |
| Review sites and directories | 2.4% | 1.6% | 39.4% |
| Government | 1.5% | 1.2% | 49.4% |
| Marketplaces and retailers | 1.5% | 7.9% | 50.6% |
| Education | 1.2% | 0.0% | 41.2% |
| Wikipedia | 0.8% | 0.8% | – |
YouTube was cited in 62.4% of AI Overviews, Reddit in 21.8% and Google’s own pages in 20.7%. On transactional searches, Google’s own pages were the largest single source type.
Most cited sources do not rank on page one
Of the 5,449 citations in the 638 AI Overviews that had both citations and organic results, 30.2% pointed to a URL in the organic top 10 of the same search (95% interval 26.8% to 33.9%) and 44.3% to a domain in it (40.4% to 48.1%). 20.2% of AI Overviews cited no top-10 URL, and 10.0% no top-10 domain. Forums, social, video and Google’s own pages rarely rank in the top 10 themselves, which explains part of the gap.
| Organic position | Share of top-10 URLs cited by the AI Overview |
|---|---|
| 1 | 50.0% |
| 2 to 3 | 37.6% |
| 4 to 6 | 27.8% |
| 7 to 10 | 21.8% |
Ranking helps: the first result was cited half the time, positions 7 to 10 about one time in five. But AI Overview source selection is clearly not the organic ranking repeated. Transactional searches had the lowest overlap (18.3% of citations in the top 10), informational the highest (34.8%).
Does the cited page support the sentence?
A pilot on 120 cited sentences. For 23 the cited page could not be read (10 forum, social or video pages, 6 Google pages, 7 others), leaving 97. Two AI models (Claude Sonnet and Claude Opus), working independently, judged each sentence against the passages of the cited page that matched it best. They agreed on 86.6% of items (Cohen’s kappa 0.8).
| Judgment | Coder A | Coder B | Both agreed |
|---|---|---|---|
| Supported | 50.5% | 50.5% | 47 |
| Partly supported (a number, qualifier or name missing or different) | 17.5% | 20.6% | 15 |
| Not supported | 16.5% | 9.3% | 9 |
| Unclear (passages too thin to judge) | 15.5% | 19.6% | 13 |
Of the 71 sentences where both coders agreed and could judge, 66.2% were supported, 21.1% partly and 12.7% not: about one in three cited sentences was not fully backed by the passage we found on the cited page. This is a pilot: it checks only the first source cited for each sentence, against selected passages rather than the whole page, and no human reviewed the labels. A missed passage would count against the AI Overview, so the true support rate may be higher.
What else was on the page
People Also Ask appeared on 95.0% of results pages, a local pack on 34.4%, video results on 16.0% and a discussions and forums block on 7.2%.
How this compares with other studies
| Source | Sample and date | Figure |
|---|---|---|
| This study | 800 US desktop keywords, 8 industries, September 2026 | 60.8% of keywords; 40.8% volume-weighted |
| Xu, Iqbal and Montgomery | 55,393 trending queries, 19 categories, 40 days, spring 2026 | 13.7% of queries; 64.7% of question-form queries |
| Pew Research Center | Real searches by 900 US adults, March 2025 | 18% of searches |
| Semrush | 10 million+ keywords, November 2025 | 15.69% of queries |
| seoClarity | 500 million+ US keywords, September 2025 | 30% of US desktop keywords |
| BrightEdge (reported by Search Engine Journal) | Tracked keywords in 9 industries, February 2026 | “nearly half” of tracked queries |
These figures do not contradict each other; they measure different populations. Trending queries (news, sport, people) rarely get AI Overviews; the commercial and research-heavy keywords businesses track often do; Pew counted the searches people actually made, whatever they were. Directional findings agree: Xu and colleagues found question-form queries far more likely to activate, and that nearly 30% of cited domains were absent from the first page of results (we find 55.7% of cited domains outside the top 10 of the same search). They found 11.0% of 98,020 atomic claims unsupported by the cited pages; our smaller pilot, judging whole sentences against one source, found 12.7% not supported and 21.1% partly supported. Pew found an AI summary on 60% of searches beginning with a question word, and Whitespark (May 2025) found AI Overviews on 15% of local-intent searches against 92% of informational ones.
Sources: Xu, Iqbal and Montgomery (arXiv) (opens in a new tab); Pew Research Center (opens in a new tab); Semrush (opens in a new tab); seoClarity (opens in a new tab); Search Engine Journal on BrightEdge (opens in a new tab); Whitespark (opens in a new tab).
Observed, inferred and unknown
What we observe. AI Overviews rarely share a results page with a local pack, in every industry where both occur. Longer, more specific wordings of the same topic get far more AI Overviews. Industries differ even after adjusting for query mix, but by less than the raw table suggests. Most cited sources do not rank in the top 10 of the same search. Some cited sentences are not fully supported by the cited page. About one keyword in six changed outcome within two days.
What we infer. Google appears to decide what kind of results page a search needs before deciding whether to add an AI Overview: searches it treats as “find a place” get a map, searches it treats as “explain something” get an AI answer. Headline AI Overview rates are mostly a description of the sample they come from.
What remains unknown. Why Google shows an AI Overview for one search and not another; this study sees only the outcome. Whether a page’s content changes its chance of being cited (nothing here tests that). How the results vary by device, location and over weeks rather than days. Whether the cited pages shaped the answer, and whether anyone clicked.
What this means
The points below are our interpretation. They follow from the findings but were not tested.
- Measure AI Overview exposure on your own keyword set. A published average says little about a given business: in our data the rate ran from 7.1% for franchise searches with a local pack to 96.9% for B2B software searches without one.
- Local businesses face two different searches. Short “service near me” searches mostly get a map, so the Google Business Profile matters there. The longer, specific questions customers ask before they call (“how much does a dental crown cost”) mostly get an AI Overview.
- Ranking helps but is not enough. The top organic result was cited half the time, and most citations went to pages outside the top 10, including video and forum pages.
- Check what AI Overviews say about you, not just whether you are cited. About one cited sentence in three in our pilot was not fully backed by the passage we found on the cited page.
Version 1.0 advised planning content around questions. That advice is withdrawn: this study shows that question-shaped searches get more AI Overviews, not that publishing question-shaped content earns more citations.
Where this sits in GEO research
Research on generative engine optimization began by asking whether changing a page changes how often an AI answer uses it. Later work compared the sources that different AI search systems draw on, and a 2026 critical survey argued that visibility should be split into stages (activation, retrieval, citation, prominence, absorption, user outcome) rather than treated as one score. This study measures the first of those stages for Google, activation, and then follows activated answers into citation, grounding and short-term stability. It is observational: it describes when AI Overviews appear and what they cite, not what would change a page’s chance of being cited.
Methodology
- Keywords: DataForSEO Labs keyword suggestions (United States, English) for 32 seed terms, four per industry; per industry the 40 highest-volume keywords plus 60 drawn at random (seed 20260926) from the remaining suggestions with at least 30 monthly searches. Question sample: suggestions beginning with a question word (how, what, why, when, which, who, where, can, does, do, is, are, should) followed by a space, 20 drawn at random per industry; 41 keywords that did not meet this rule were replaced before analysis.
- Matched wordings: 96 of the 800 (12 per industry, seed 20260928), excluding keywords that already began with a question word or contained “near me”. For each, a natural question and a long non-question form on the same topic were written by the research team with an AI model; the full list is in the downloads.
- Results pages: DataForSEO SERP API, Google.com, United States, English, desktop, top 10 organic results, asynchronous AI Overviews loaded; one search per query on 26 September 2026 (960) and 28 September 2026 (288).
- Activation model: logistic regression of AI Overview presence on industry, DataForSEO intent, local pack, “near me”, word count and log volume, with standard errors clustered by the 32 seed topics. Industry before and after adjustment uses average predicted probabilities. Price or cost words are reported descriptively because every such keyword showed an AI Overview. Predictive comparisons use 8-fold cross-validation grouped by seed topic.
- Matched tests: exact McNemar tests on the 96 pairs, and a logistic model of wording plus word count clustered by topic.
- Citations: all distinct cited links in each AI Overview, normalized (tracking parameters, fragments, “www.” and trailing slash removed). Top-10 overlap compares each cited URL, or its registrable domain, with the organic top 10 of the same results page. Source types use a fixed domain list.
- Grounding pilot: 120 AI Overviews (15 per industry, seed 20260928), one cited sentence each; the first cited page fetched; the six passages sharing most words with the sentence (up to 4,500 characters) judged independently by two AI models; figures on items where both agreed. Model-coded, not human-validated.
- Uncertainty: 95% bootstrap intervals resampling the 32 seed topics (2,000 resamples, seed 20260926).
- Update schedule: a further date for these keywords with our week-over-week volatility study (on or after 3 October 2026); monthly after that.
Limitations
- The sample is commercial keywords in eight industries, leaning to high volume. It does not estimate the share of all Google searches with an AI Overview.
- Observational. The local pack is chosen by Google, so its link with fewer AI Overviews is an association, not a cause.
- The matched wordings were written by us to keep the topic; they also add detail, so the effect of the question form and of length cannot be fully separated.
- One search per query per date from one US location on desktop. Stability covers two dates and 96 keywords.
- The grounding pilot is small, model-coded, uses the first cited source only and judges selected passages, not the full page; 23 of 120 sources could not be read.
- Intent labels come from DataForSEO’s classifier. Source types do not separate a brand’s own site from independent publishers.
What changed in version 1.1
Version 1.0 (26 September 2026) reported how often AI Overviews appeared by industry and type of search. Following an external review, version 1.1 (28 September 2026) reframes the study around when AI Overviews activate and what happens next. It adds a clustered logistic model, industry figures before and after adjustment, the local pack effect after adjustment, a predictive comparison, a denominator and sampling-frame analysis, a matched wording experiment with 288 new searches, a second date for 96 keywords, citation overlap with the organic top 10, and a model-coded grounding pilot. All version 1.0 figures are unchanged. The advice to plan content around questions was withdrawn because the study does not test it.
Data and downloads
- All 960 keywords with features, AI Overview result and top-10 overlap: s4_keywords_v11.csv and JSON
- Matched wordings, 288 searches: s4_matched_forms.csv and the wording list
- Grounding pilot with both coders’ labels: s4_grounding_pilot.json
- Every statistic on this page: stats.json
- Machine-readable methodology: methodology.json
- Charts: industry before and after adjustment and three wordings
- Version 1.0 data and statistics: s4_keywords.csv and stats_v1.0.json
The data is free to reuse with attribution (CC BY 4.0).
To cite: Underneath. (2026). When does Google show an AI Overview? 1,248 US searches (Version 1.1). Underneath Research. https://underneath.agency/research/ai-overviews-frequency-study
Frequently asked questions
What percentage of Google searches show an AI Overview?
There is no single figure. In our sample of 800 US commercial keywords, 60.8% showed one, or 40.8% weighted by search volume. A 2026 study of trending queries found 13.7%. The rate depends mostly on the mix of searches: local, map-led searches rarely get one, and specific questions almost always do.
Which industries see the most AI Overviews?
B2B software and technology (96.0% of keywords) and financial services and insurance (88.0%). After adjusting for query mix they are still highest (83.0% and 77.7%), but the gap between industries shrinks from 60.0 to 36.7 points.
Do local searches show AI Overviews?
Rarely. When Google showed a local pack, an AI Overview appeared on 21.8% of searches, against 81.1% without one. The gap held in every industry with local packs and after adjusting for intent, length and volume.
Do question searches trigger AI Overviews more often?
Yes. When we searched the same 96 topics three ways, 93.8% of the questions showed an AI Overview, against 59.4% of the original keywords. A long non-question wording of the same topic reached 87.5%, so most of the lift comes from a longer, more specific search, not the question word itself.
Do AI Overviews cite the pages that rank first?
Partly. 30.2% of cited URLs were in the organic top 10 of the same search, and 20.2% of AI Overviews cited none of the top-10 URLs. The first organic result was cited half the time.
How many sources does an AI Overview cite?
A median of 8, with the middle half between 6 and 10. Only 0.8% cited none.